COVID-19 in New Jersey
Note: the COVID Tracking Project ended on March 7, 2021, which also marks the last data update on this page. My most sincere thanks to those who contributed to the COVID Tracking Project. Please go to the Johns Hopkins University Coronavirus Resource Center for up-to-date information about COVID-19 in New Jesrey.
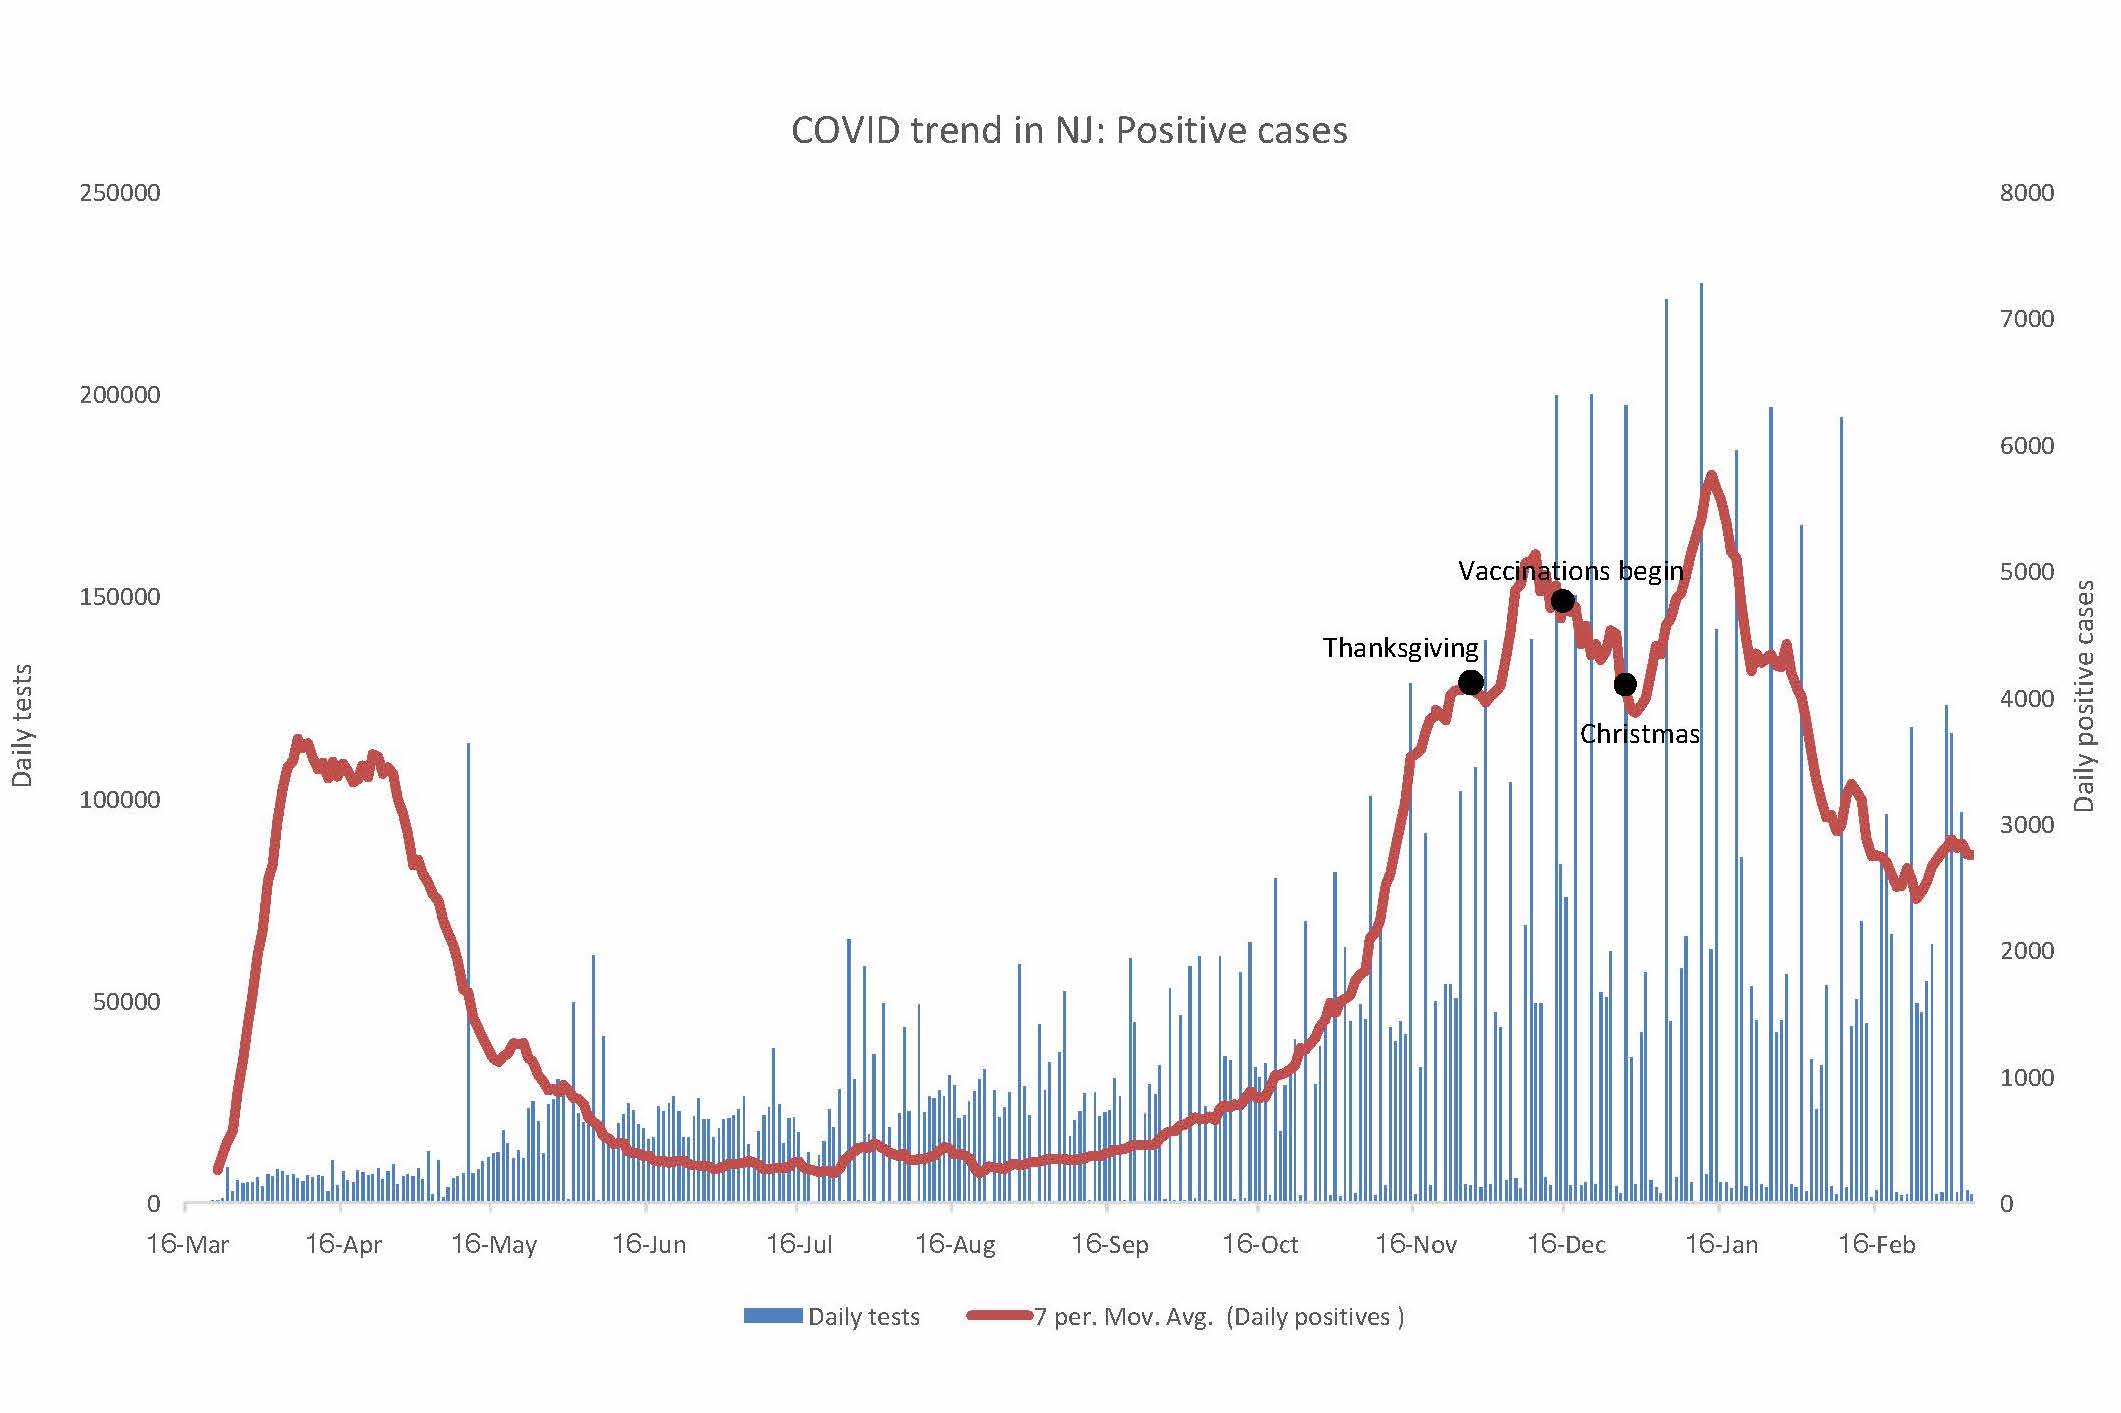
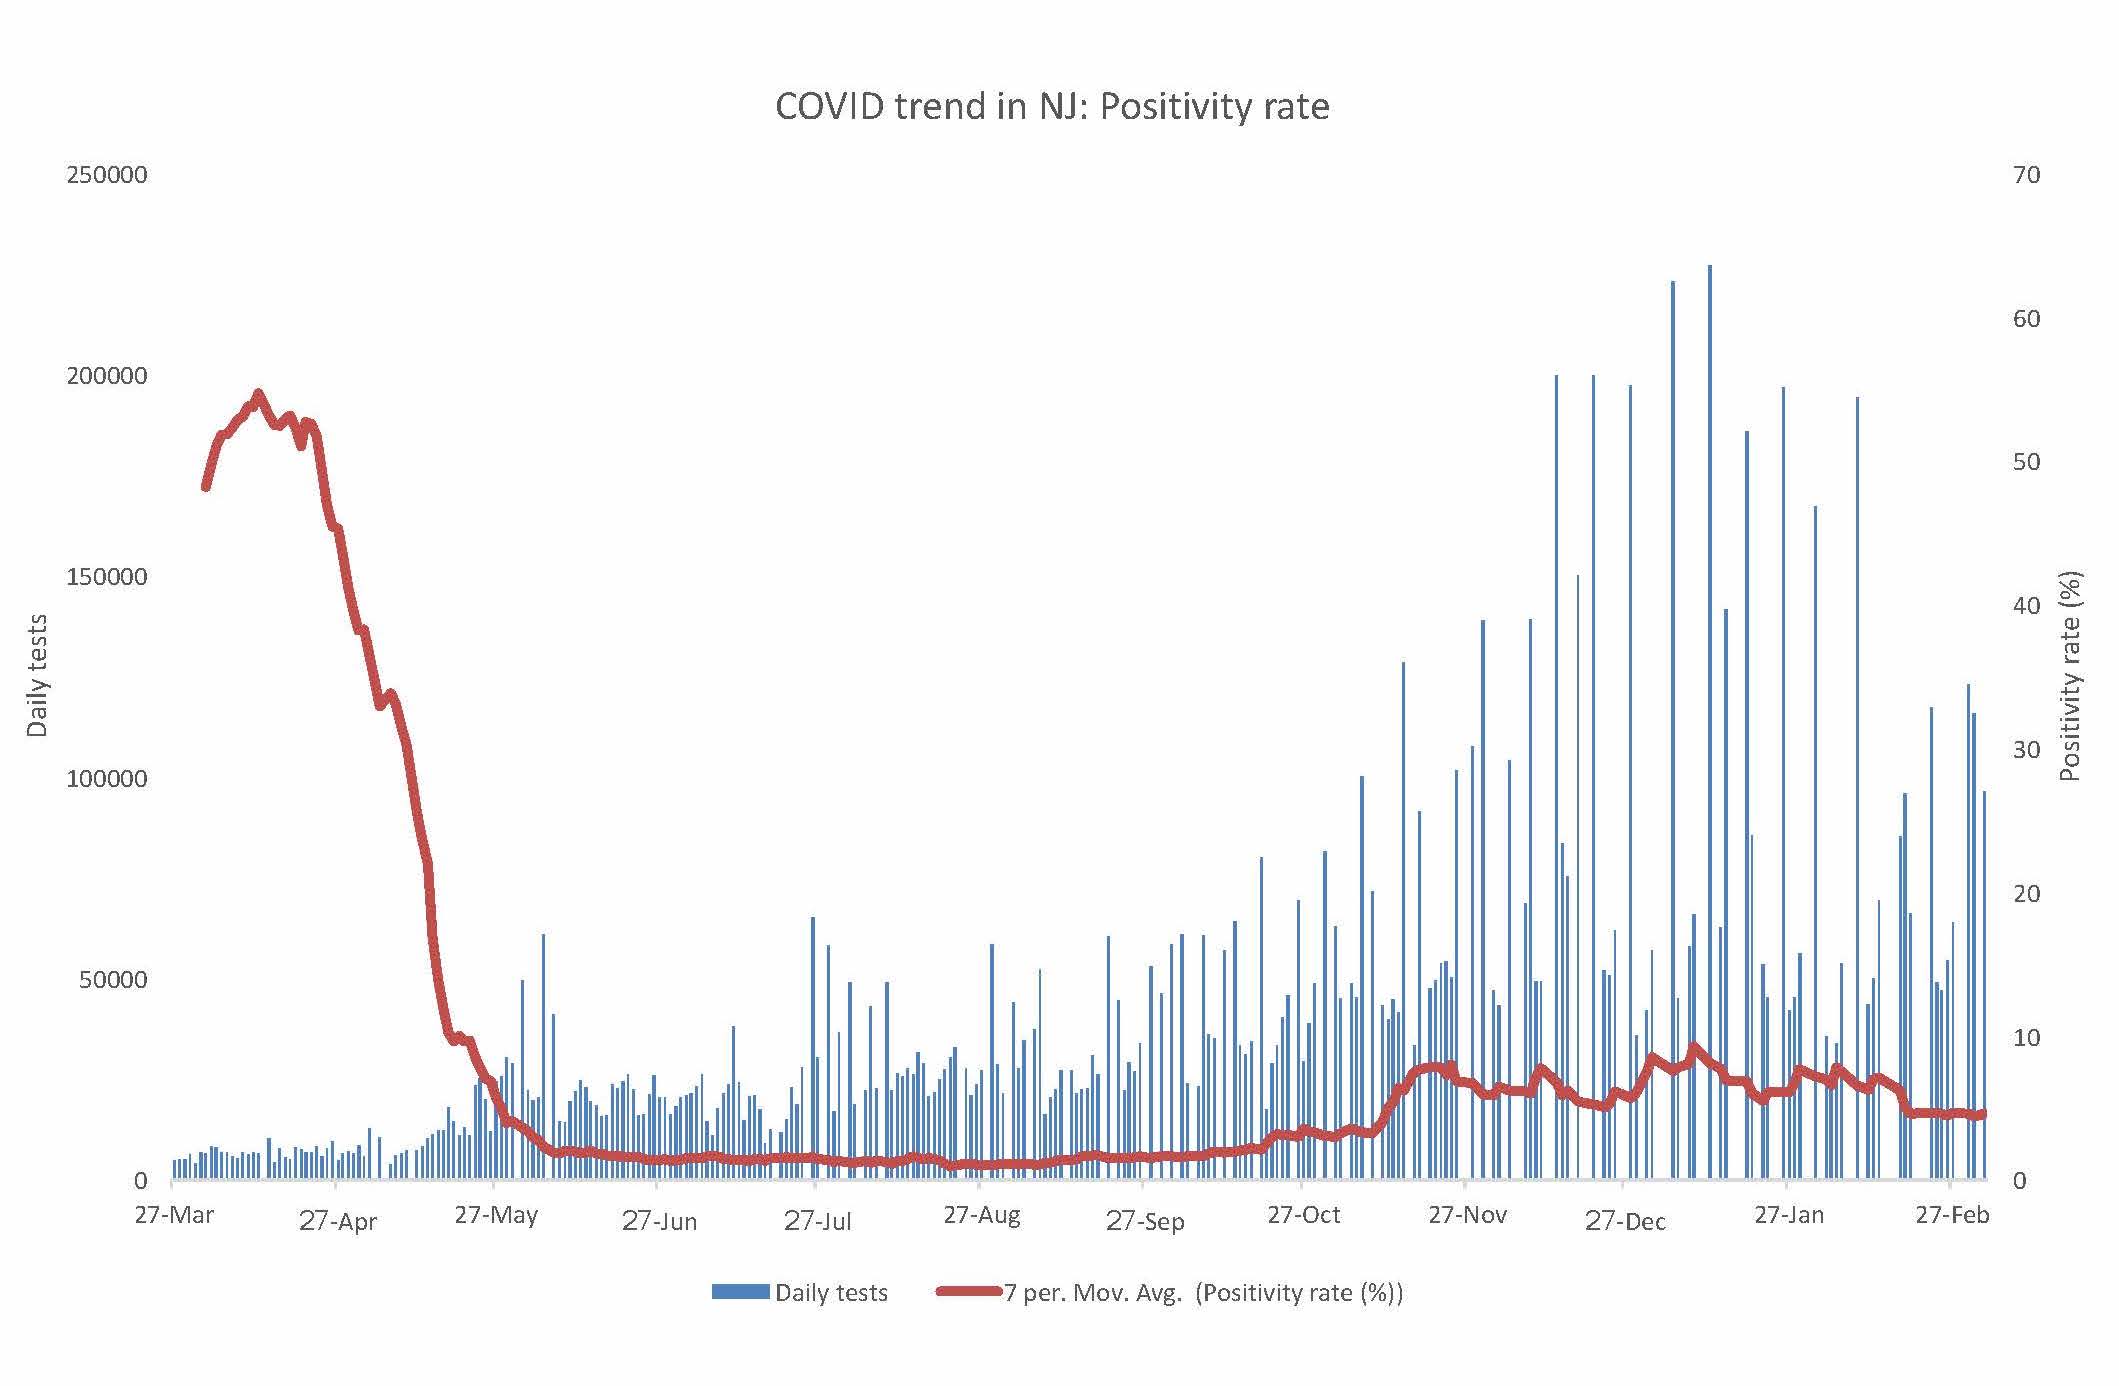
I have been using data from the COVID Tracking Project website to track COVID-19 in New Jersey. The lines show the 7-day moving average of the daily confirmed positive cases and the positivity rate, respectively. The bars show the number of daily tests in NJ. The number of daily positive cases declined in the summer from its peak at over 4,000 cases in mid-April, 2020. Since the beginning of the Fall, the number of daily positive cases has been increasing, with peaks following the Thanksgiving and Christmas holidays. The number of cases in this second wave has been following a downward trend since mid-January, 2021. The testing positivity rate tracks the percentage of tests which came back positive each day. The positivity rate has been falling gradually to single digits from its peak at 58% in mid-April 2020. The decrease in positivity rate is explained by an increase in the number of people tested each day. COVID vaccinations began on December 15th in NJ.


