| Dataset | amelia-20200825T1929 |
|---|---|
| Glider | amelia |
| Status | Completed |
| Summary | This project supports the deployment and realtime data delivery of autonomous underwater gliders in the coastal ocean to better resolve and understand essential ocean features and processes that contribute to hurricane intensification or weakening prior to making landfall. This is a partnership between NOAA Ocean and Atmospheric Research (OAR) through the Atlantic Oceanographic and Meteorological Laboratory (AOML) and Integrated Ocean Observing System (IOOS) regional associations such as MARACOOS, SECOORA, CariCOOS and institutions including the University of Puerto Rico, University of the Virgin Islands, Skidaway Institute of Oceanography, University of Delaware, Virginia Institute of Marine Science - William & Mary, and Rutgers University. The goal of the project is to provide realtime data for ocean model validation and assimilation throughout hurricane season. This project is supported by the Disaster Recovery Act. The glider was deployed out of Virginia Beach, VA over the mid-shelf region of the southern Mid-Atlantic Bight and will transect offshore to the shelf break 75 km south of Norfolk Canyon. The glider will then head northward toward Norfolk Canyon, then toward an inshore point at about 35 meters depth in between Norfolk and Washingont Canyons, then head toward the shelfbreak north of Washington Canyon. The triangle pattern between Norfolk Canyon south, 35 m isobath, and Washington Canyon north will then repeat. This real-time dataset contains CTD measurements from a RBRlegato3 inductive CTD |
| WMO ID | 4801934 |
| Attribution | NOAA, United States Navy, IFAA, OAR, AOML |
| Time Coverage Start | 2020-08-25 19:59:18 UTC |
| Time Coverage End | 2020-09-25 14:32:48 UTC |
| Registered | 2020-08-26 |
| Deployed | 2020-08-25 |
| Operator | Virginia Institute of Marine Science - William & Mary |
| Institution | Virginia Institute of Marine Science - William & Mary |
| Data Provider | rutgers |
| # Profiles | 2166 |
| Days Deployed | 31 |
| BBox North | 37.354 |
| BBox South | 36.335 |
| BBox East | -75.36 |
| BBox West | -74.444 |
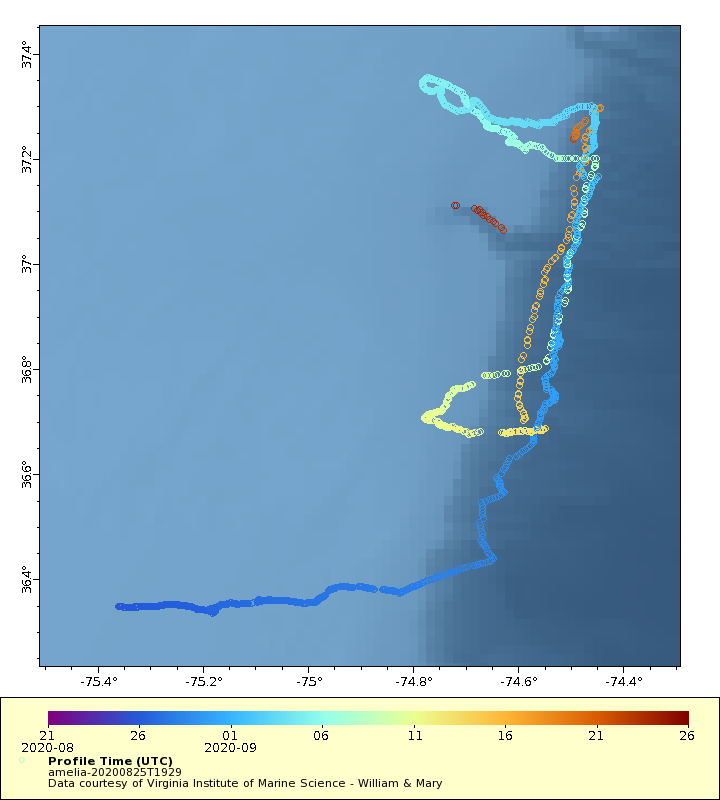
Maps
Track
Latest Profiles
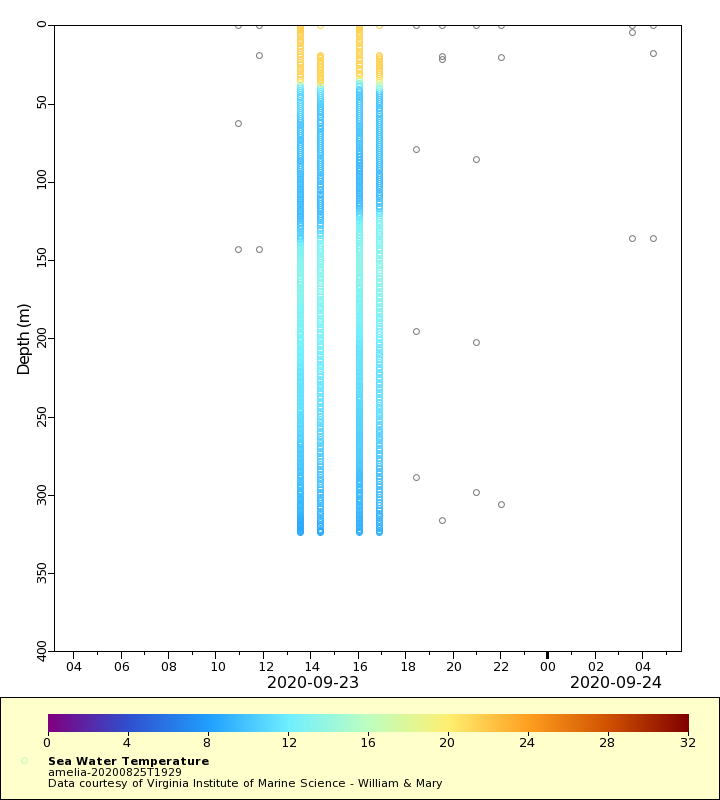
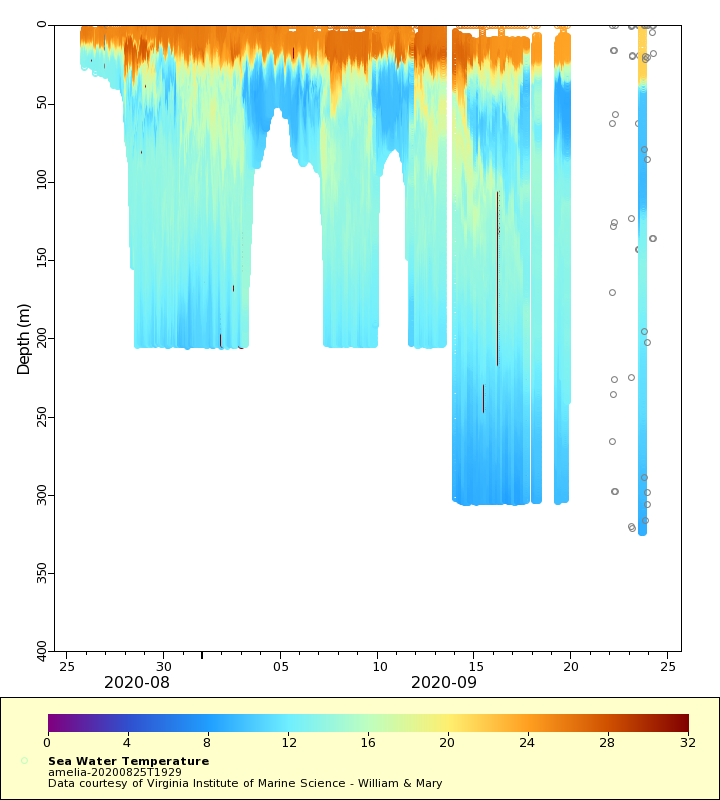
Temperature

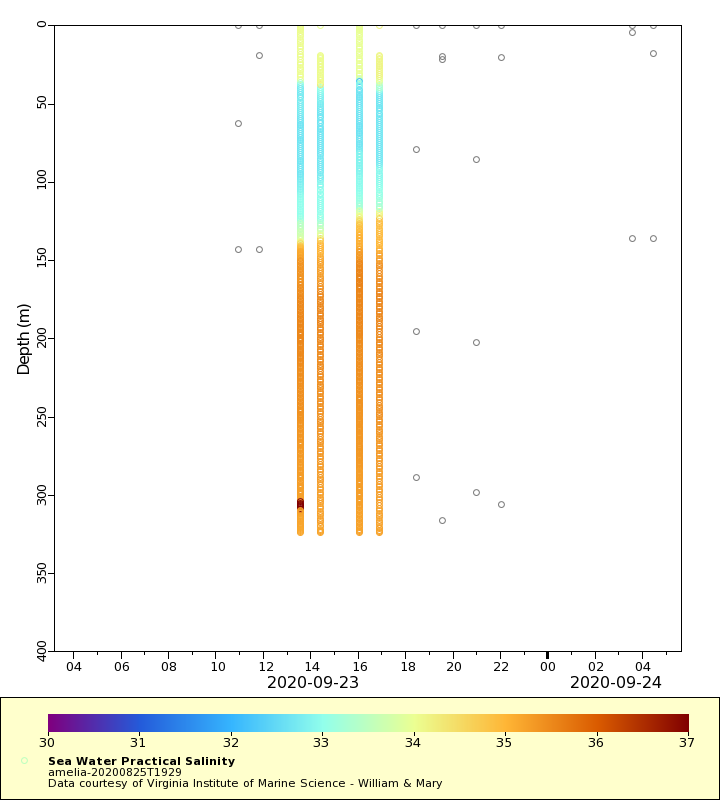
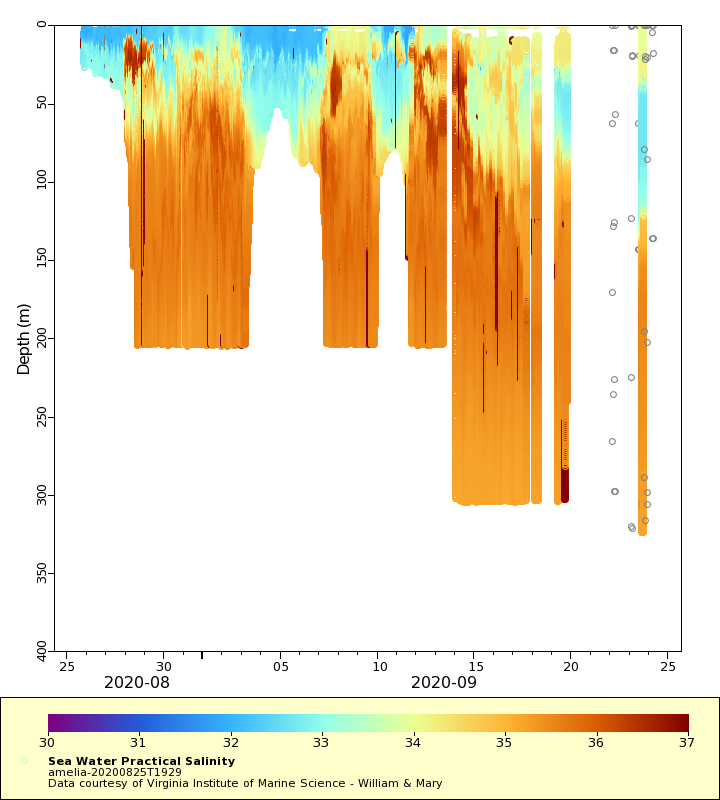
Salinity

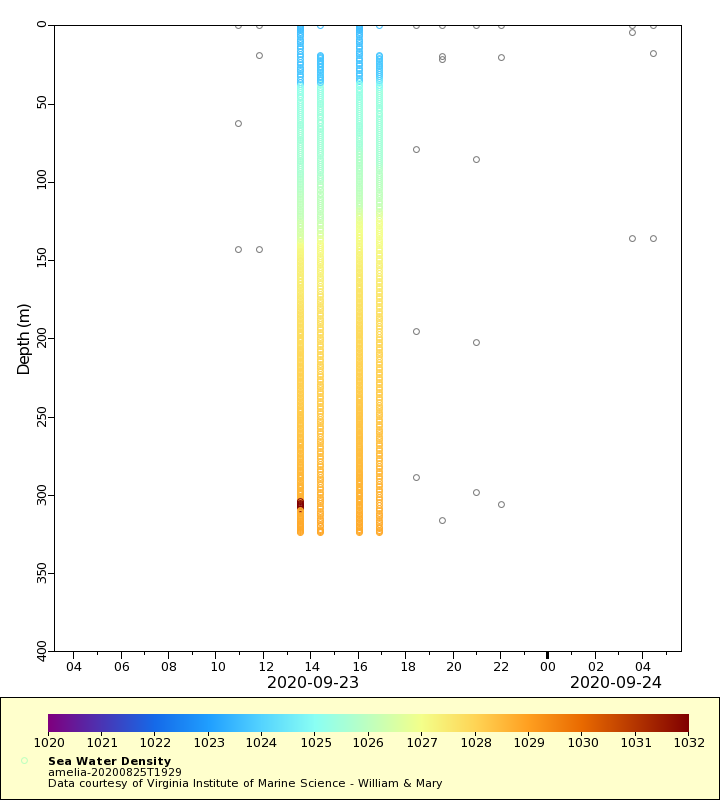
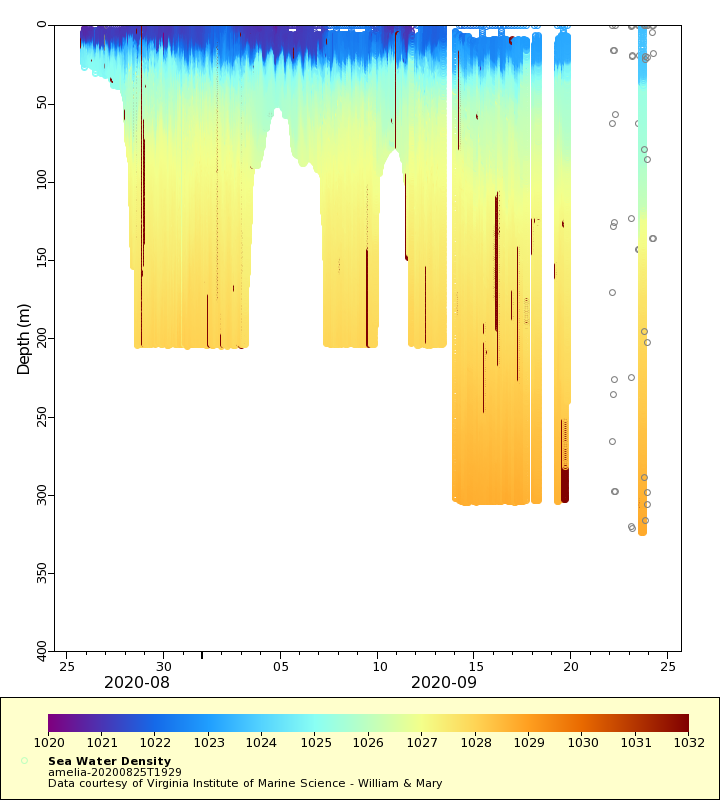
Density
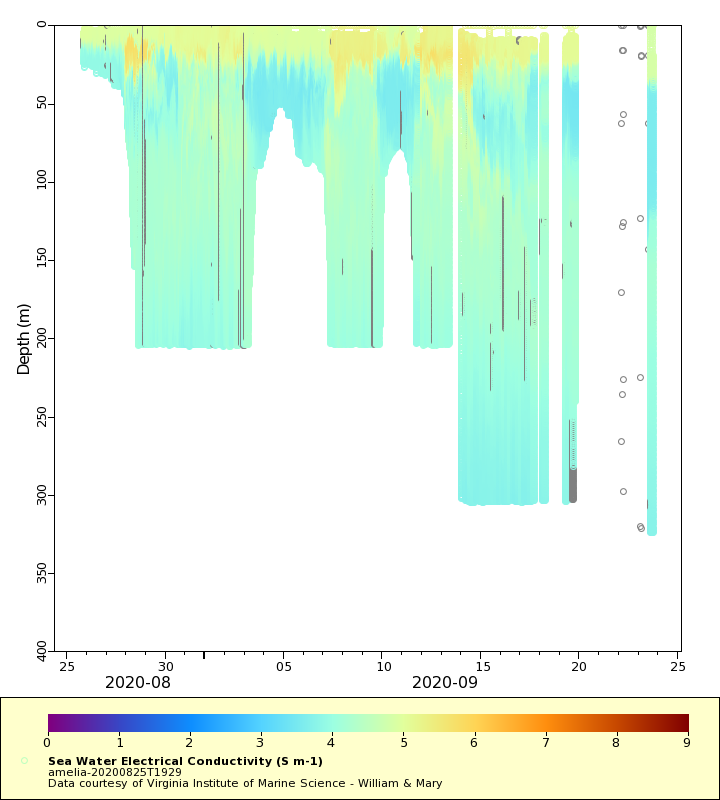
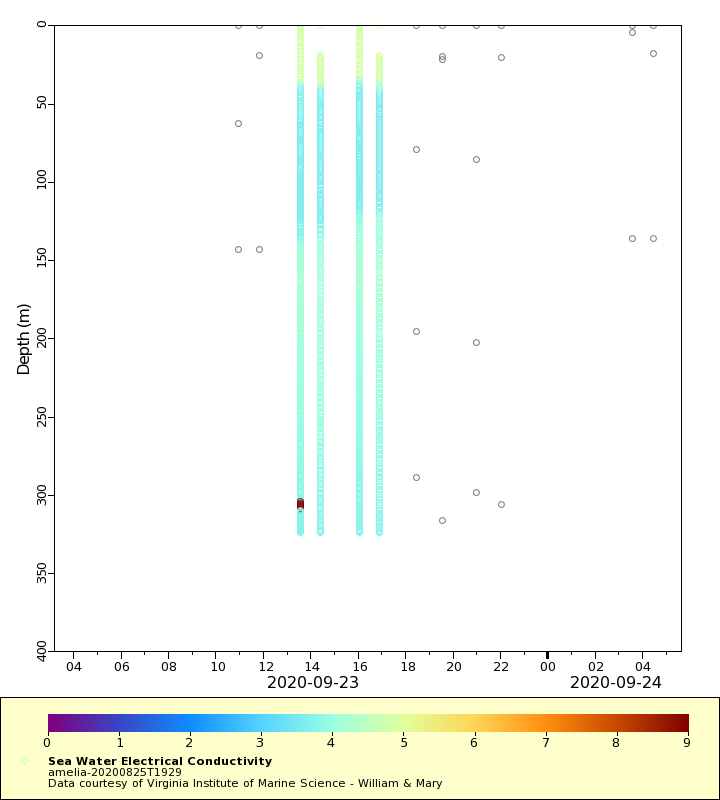
Conductivity
Latest Timeseries
Temperature
Salinity
Density
Conductivity
Synoptic Timeseries
Temperature
Salinity
Density
Conductivity