The Use of CODAR High Frequency
Radar to Attain Wave Height Measurements

What Can the data be used for?
The Use of CODAR High Frequency
Radar to Attain Wave Height Measurements
What Can the data be used for?
The direction of propagation
of wave energy and the period of the most energetic waves are important
for many practical applications, e.g., the design and and operation of
coastal and offshore structures and storm surge forecasts.
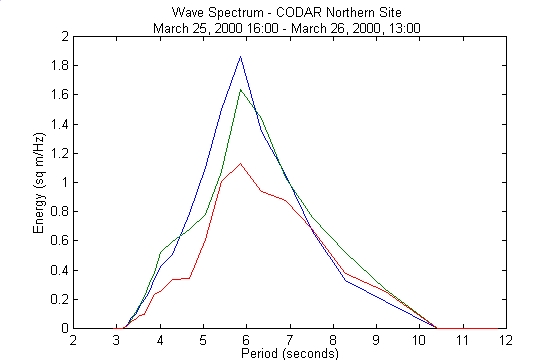
Figure 1 - Spectral analysis
of CODAR wave data from LEO-15 over three days in March, 2000 shows that
the dominant waves at the first part of the measurement period are approximately
6-second locally wind-generated waves. Each line on the plot above
is a 7-hour average.
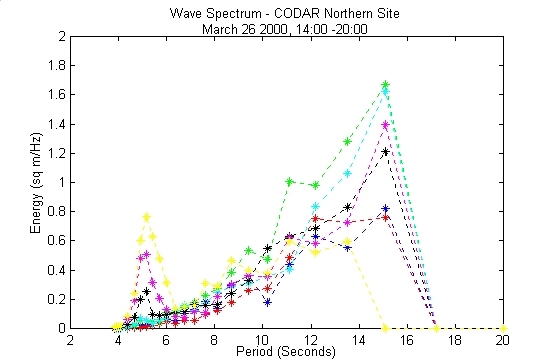
Figure 2 - Additional
data from the three-day period, now moving to hour averages so that the
shift from 6-second to wind-generated waves to dominant 15-second swell
can be seen. The blue then red lines occur first, followed by green
and cyan, and finally black, pink and yellow. This shows energy from
the swells building, peaking and then decreasing again. The pattern
above could suggest swell from an offshore storm appearing at the coast.
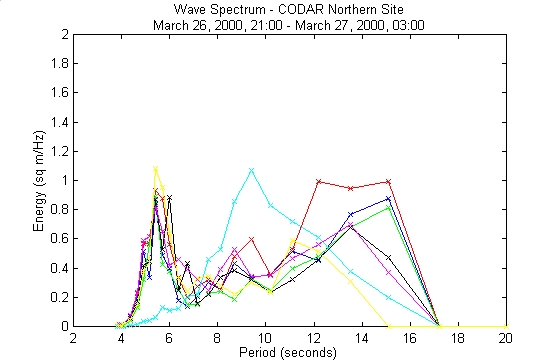
Figure 3 - Energy contained by the 15-second swell continues to decrease, as we see a further shift of the dominant waves to waves of a lower period. Each line represents and hourly average. Chronological order of the colored lines is as in the previous plot (blue, red, green, cyan, black, pink, yellow).