Coastal Ocean Dynamics Applications Radar (CODAR)
Real-Time Data
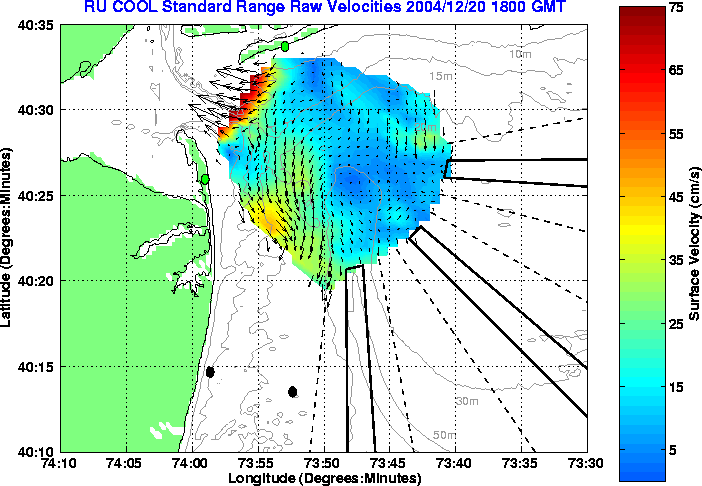
Raw Vector Field
The raw surface current is the unprocessed
data measured by CODAR. Therefore the following vector plot is the summation
of all sources of current, including tides and wind.
Tidal Vector Field
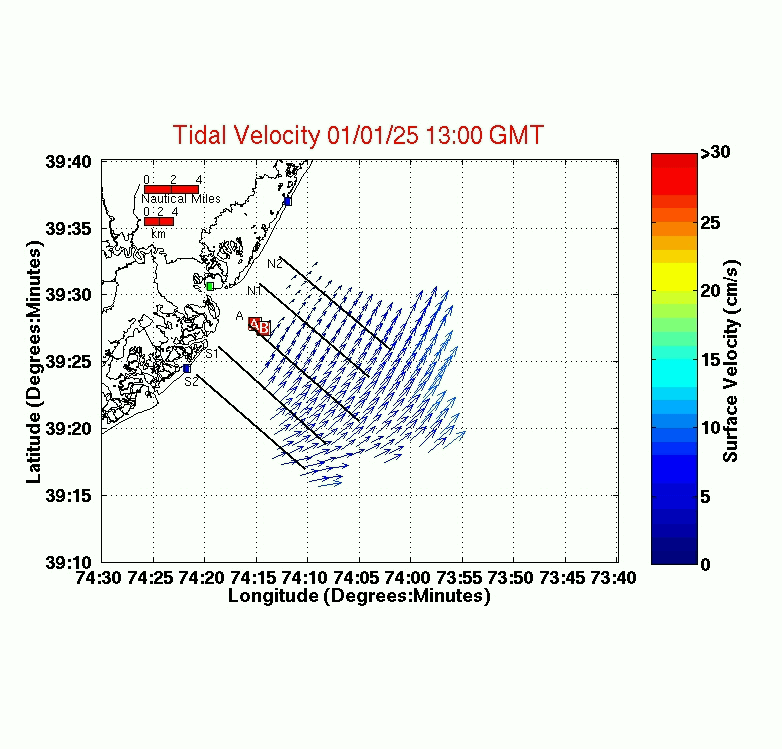
The Tidal vector field represents the currents
that are subtracted from the raw data to get the detided current fields.
In this step, local tidal currents are subtracted from the
raw data. The following tidal constituents
were used to calculate the tidal currents:
- Half a Lunar Day (Period = 12.42 Hours)
- Half a Solar Day (Period = 12.00 Hours)
- A Lunar Day (Period = 25.82 Hours)
- Luni-Solar (Period = 23.93 Hours)
- Larger Lunar Elliptic (Period = 12.66 Hours)
Using the above periods, a predicted tide is determined and plotted.
Detided Vector Field
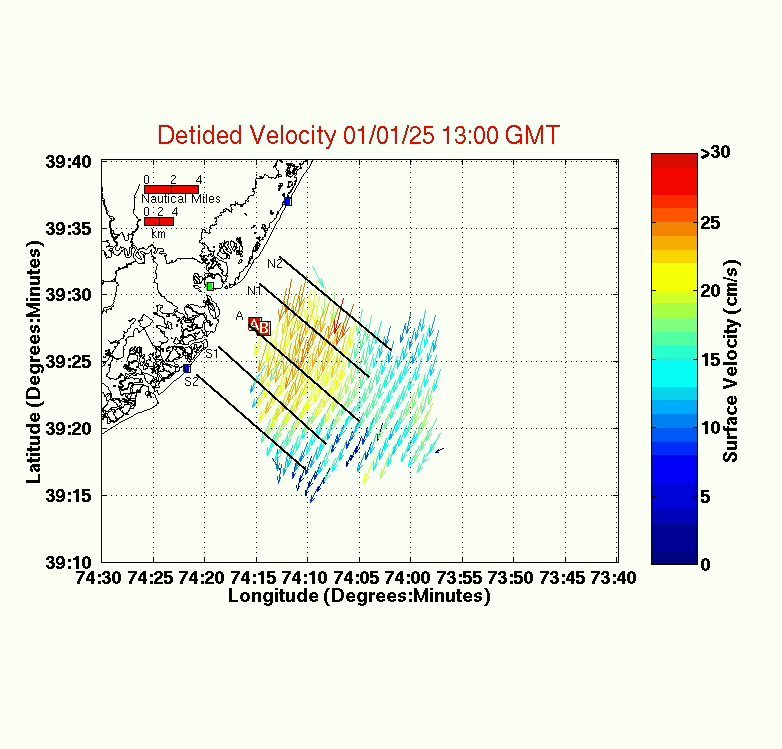
The detided vector field represents the
first step of data processing. In this step, local tidal currents are subtracted from the
raw data. These local currents are calculated by getting a least
squares fit to regional tidal oscillations. The following tidal constituents
were used in the processing:
- Half a Lunar Day (Period = 12.42 Hours)
- Half a Solar Day (Period = 12.00 Hours)
- A Lunar Day (Period = 25.82 Hours)
- Luni-Solar (Period = 23.93 Hours)
- Larger Lunar Elliptic (Period = 12.66 Hours)
Using the above periods, a predicted tide is calculated and then subtracted
from the raw data field.
Low-pass Vector Field
The low-pass surface current field
is representative of the second step of data processing. A low-pass filter
is applied to the detided data to further eliminate any other short
frequency currents. The data is delayed three hours because the filter needs
information up to three hours after the time of calculation.

High-pass Vector Field
The short frequency currents are calculted by subrtacting the low-pass field from the detided field.

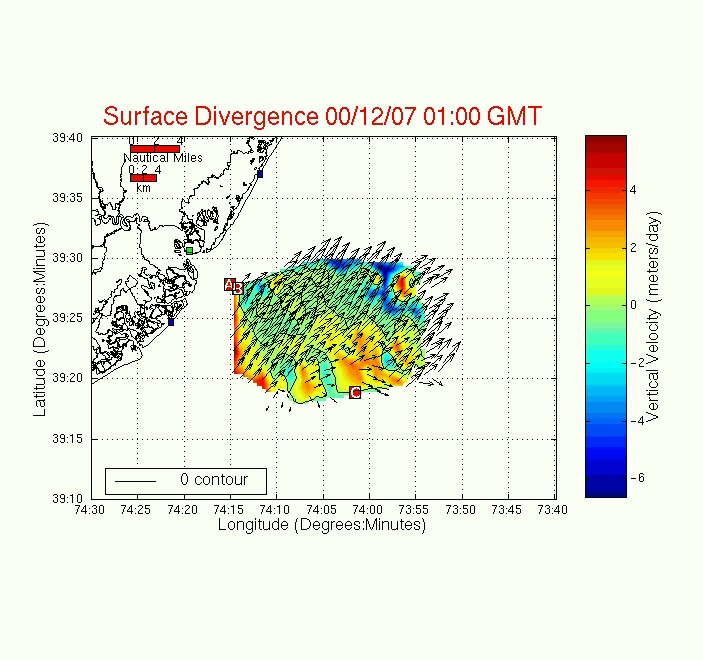
Surface Divergence
The surface divergence is calculated based on
the low-pass current field. It is a measure of if water motion toward or
away from a particular point on the ocean surface.
Positive values represent water being forced away and negative values
represent water forced toward the surface point.
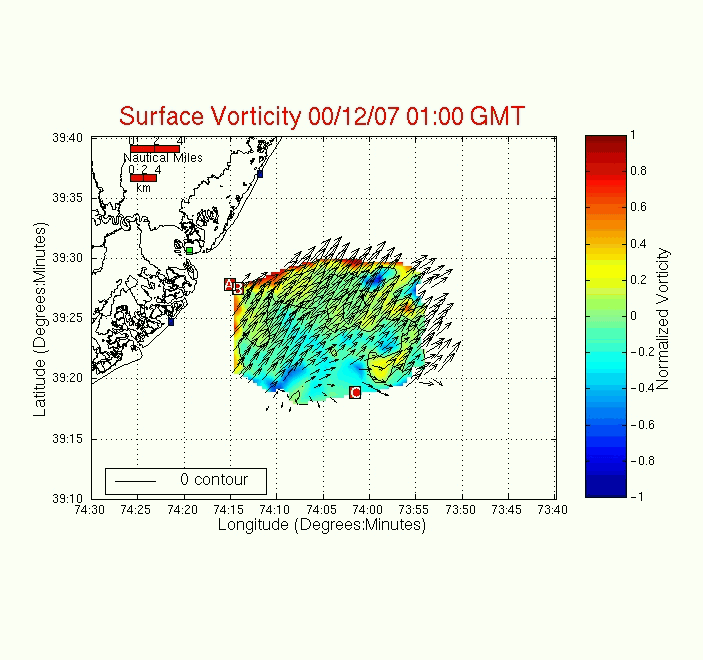
Surface Vorticity
The following surface vorticity plot is
calculated based on the low-pass current field. Surface vorticity
is a measure of the "spin" of a partical about its axis. Counterclockwise
rotation is positive and clockwise rotation is negative.
