CHARACTERIZING THE VARIABILITY IN THE INHERENT AND APPARENT OPTICAL
PROPERTIES DURING THE LEO-15 1998 COASTAL PREDICTIVE SKILL EXPERIMENTS
By Mark M. Moline & Oscar M. Schofield
Presented at ASLO-99, on February 5, 1999, in Santa Fe, NM
Our phenomenological focus during the 1998 Coastal Predictive Skill (CPS)
experiments was to characterize the impact of coastal
upwelling in shallow
waters (5-30 m) on nearshore bulk optical properties. Shipboard data was
complemented by ocean color data collected by the SeaWiFs satellite. The
timing and location of the shipboard transects were adaptively adjusted
based upon real-time data collected from the
LEO-15 profilers, satellites
and physical shipboard surveys. Optical properties on the ships were
measured using a Wetlabs absorption/attenuation meter (ac-9), a Wetlabs
submersible fixed wavelength spectrofluorometers (SAFIRE), a profiling
Satlantic spectroradiometer, and a BioSpherical spectroradiometer.
A short summary of what we learned is shown below.
 Figure 1. The upwelling eddy and front are clearly
visible in AVHRR, surface
current radar, and SeaWiFs imagery. According to the ocean color data,
pigment concentrations were clearly enhanced within the
upwelling waters. Prior to the upwelling, satellite imagery indicated low
pigment concentrations in these nearshore waters. In collaboration with
Dr. Robert Arnone (Naval Research Laboratory) efforts are underway to test
ocean color algorithms being developed for Case 2 coastal waters.
Attenuation at 440 nm
 Figure 2. The in situ inherent optical properties varied in space in time.
This figure shows several cross shelf transects of light attenuation at 440
nm as measured with an ac-9 during the 1998-CPS experiments. Prior to
upwelling, the optical loads in these coastal waters were low, except for
very nearshore. The heavy optical loads here reflected the material being
transported out of the local estuaries. Upon initiation of upwelling, the
optical front was extended further offshore. The edge of the offshore
optical front agreed well with the satellite and radar imagery. The
optical front moved inshore as the upwelling ended.
 Figure 3. A) The offshore extent of the optical
front was clearly extended
offshore by the coastal upwelling.
B) There was good agreement between the
apparent and inherent optical properties.
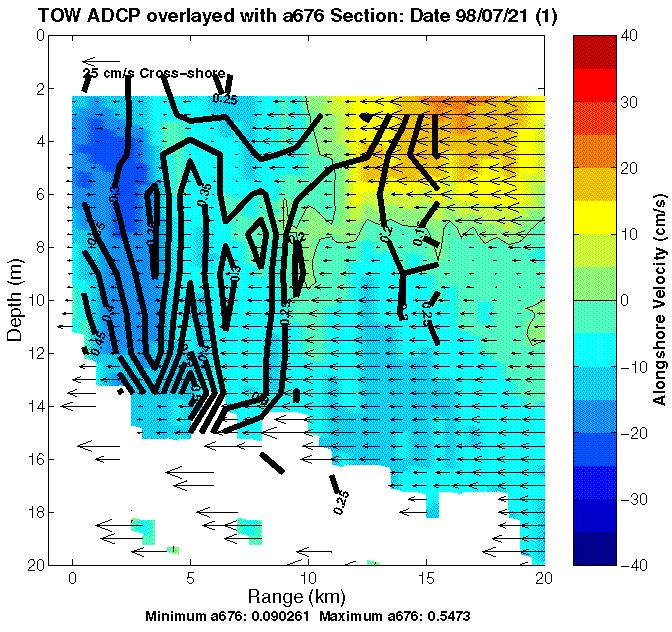
 Figure 4. Other then the optical front,
there was significant vertical
variability in the inherent and apparent optical properties. This
variability could largely be accounted for by the local current patterns.
This figure illustrates local current patterns as measured an ADCP mounted
on the Majid tow vehicle. Overlaid on the hydrography is the absorption as
measured by an ac-9 at 676 nm. Optical loads were clearly enhanced within
water flowing to the south in the nearshore waters. These optical loads
were dominated by particulate matter and had fluorescence loads indicating
the presence of phytoplankton.
Conclusions
1) The optics prior to upwelling is low in offshore waters and the
nearshore waters are dominated by material being transported out of the
local estuaries.
2) Upwelling results in enhanced phytoplankton concentrations, which is
clearly visible in both satellite and in situ optical data.
3) Upwelling extends the optical front further offshore. The optical front
moves inshore as upwelling ends.
4) Vertical variability in the inherent optical properties is driven by
local current patterns.
I hope you enjoyed this annotated presentation on optical properties at
LEO-15. If you have any questions email Oscar Schofield at the
address below.
Questions???
oscar@ahab.rutgers.edu


