Assimilation of CODAR HF-RADAR into The Regional Ocean Model System
(ROMS)
By Hernan Arango
Presented at ASLO-99, on February 5, 1999, in Santa Fe, NM
During the LEO-15 Coastal
Ocean Predictive Skill Experiments of 1998,
Coastal Ocean Dynamics Applications RADAR
(CODAR by SeaSonde Inc.)
surface currents were assimilated into an ocean forecast model (ROMS)
for the first time anywhere.
The assimilation of CODAR data proved to be huge success in bringing the model
output very close to reality. The four figures below show a short outline of
the modeling process.
 ROMS model output of the upwelling front for July 20 at 9:00 GMT. The colors
indicate the ocean surface temperature, while the arrows indicate surface
current speed and direction. Here, all the surface currents are moving NE
parallel to the coastline. Also, the upwelling front is a single band of
cold water along the coast, with little or no pertubations along it. This
model output was dissimilar to the actual data pictured on the figure at
the bottom of this page.
ROMS model output of the upwelling front for July 20 at 9:00 GMT. The colors
indicate the ocean surface temperature, while the arrows indicate surface
current speed and direction. Here, all the surface currents are moving NE
parallel to the coastline. Also, the upwelling front is a single band of
cold water along the coast, with little or no pertubations along it. This
model output was dissimilar to the actual data pictured on the figure at
the bottom of this page.
 This model output was created assimilating hourly CODAR vectors. Notice that
instead of a broad band of upwelling with currents moving Northeast, there
are now 3 upwelling centers (two are partially cut off), with current
rotations around the middle upwelling center. The CODAR data used here
was detited, low-pass filtered, and then vertically extended using the
most energetic (81%) Empirical Orthogonal Functions (EOF)
from Acoustic
Doppler Current Profiler (ADCP) data. The data were assimilated as horizontal
vector components, computed by combining the radial data from each CODAR
site. Unfortunately, this procedure tends to eliminate some of the data,
unlike assimilation of raw CODAR radials,
which does not eliminate any data.
This model output was created assimilating hourly CODAR vectors. Notice that
instead of a broad band of upwelling with currents moving Northeast, there
are now 3 upwelling centers (two are partially cut off), with current
rotations around the middle upwelling center. The CODAR data used here
was detited, low-pass filtered, and then vertically extended using the
most energetic (81%) Empirical Orthogonal Functions (EOF)
from Acoustic
Doppler Current Profiler (ADCP) data. The data were assimilated as horizontal
vector components, computed by combining the radial data from each CODAR
site. Unfortunately, this procedure tends to eliminate some of the data,
unlike assimilation of raw CODAR radials,
which does not eliminate any data.
 Here we have a model output for the same time, but created by assimilating
radial data. Notice that the upwelling center is better defined when the
CODAR radials are assimilated and better compares to the AVHRR Sea Surface
Temperature image below.
Here we have a model output for the same time, but created by assimilating
radial data. Notice that the upwelling center is better defined when the
CODAR radials are assimilated and better compares to the AVHRR Sea Surface
Temperature image below.
 AVHRR Sea Surface Temperature (SST) image for July 20, at 11:57 GMT. Notice
how the central upwelling center, and the edges of upwelling centers to
the north and south agree with the radial model output above.
AVHRR Sea Surface Temperature (SST) image for July 20, at 11:57 GMT. Notice
how the central upwelling center, and the edges of upwelling centers to
the north and south agree with the radial model output above.
There is an item of interest to point out here. The SST data is
approximately 2 degrees C cooler than all of the model output. This problem
with surface heat flux input from last summer will be improved by coupling
to an atmospheric model during this summer's experiment.
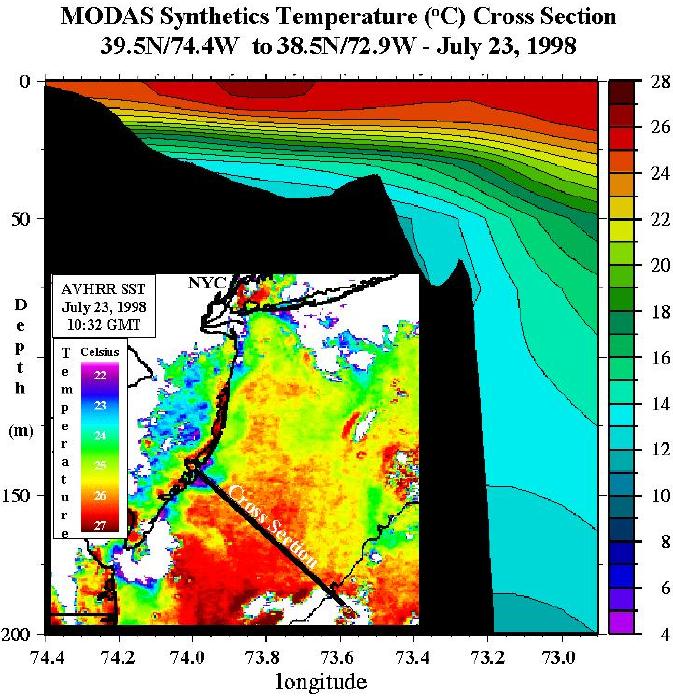 This final figure is a cross-shelf temperature section through LEO-15
for July 23, 1998, generated by the Naval Research Lab using the
Modular Ocean Data Assimilation System (MODAS). Note how this forecast
overestimates general surface temperatures by 1-2 degrees Celsius, and
completely misses the upwelling front located at the coast (shown on
the AVHRR SST inset). Our
research is being done to improve these types of forecasts.
This final figure is a cross-shelf temperature section through LEO-15
for July 23, 1998, generated by the Naval Research Lab using the
Modular Ocean Data Assimilation System (MODAS). Note how this forecast
overestimates general surface temperatures by 1-2 degrees Celsius, and
completely misses the upwelling front located at the coast (shown on
the AVHRR SST inset). Our
research is being done to improve these types of forecasts.
Questions???
arango@arctic.rutgers.edu