Modeling Convective Mixing: Improvements on the Industry Standard
and It's Importance to Biological Production Modeling
By Scott Durski
&
Edward Levine
Presented at ASLO-99, on February 5, 1999, in Santa Fe, NM
During the LEO-15 Coastal
Ocean Predictive Skill Experiments of 1998,
improvements were made to the convective mixing models currently available.
The figures below show a short summary of the improvements, and how they
compare to real data taken from a Naval Underwater Warfare Center Turbulence
REMUS cross shore transect.
Color Contours of Vertical Viscosity, with Density Overlay.
 The above figure displays color contours of vertical viscosity with temperature
overlayed for day 2 of an idealized upwelling simulation. A comparison is
made between two vertical mixing schemes. The top frame displays the industry
standard Mellor-Yamada level 2.5 closure approximation, while the bottom frame
displays a modified version of the Large, McWilliams and Doney K-profile
parameterization, which includes the effects of bottom generated turbulence.
Our modified scheme is shown to produce viscosity profiles quite similar to the
Mellor Yamada scheme in the offshore region, but differs significantly from it
in the frontal region.
Convective Mixing During Moderate Upwelling
 The above plots explain the high viscosities displayed on the previous slide.
The frames display across-shore velocity (top left), density(top right),
vertical viscosity (bottom left) and vertical velocity(bottom right).
The high vertical mixing in the frontal region is caused by interior
convection. The pycnocline is advected upward in the near shore region from
a depth of onshore flow, to a depth in which offshore flow occurs. Thus
unstable stratification is generated in the interior and convective mixing
occurs. The magnitude of the vertical viscosity predicted by the model
both here and offshore of the front agrees well with turbulence measurements
made off the coast of New Jersey during the summer of 1998. These turbulence
measurements are shown below.
Mixing Parameter Data from the NUWC Turbulence REMUS at 5 Meter Depth
 The Naval Underwater Warfare Center (NUWC) Turbulence REMUS data
acquired during an upwelling event on July23, 1998 is shown above. The four
parameters shown were calculated from REMUS-based turbulence data acquisition
in the upwelling gyre center (pink area/near shore) and in the offshore leg
(blue region). The vertical eddy viscosity changes at the 5m level across the
upwelling front agree reasonably well with idealized predictions of the modified
KPP model
for the case of ultilzing the Large et al (1994) model for the surface and
bottom boundary layers, and including convection.
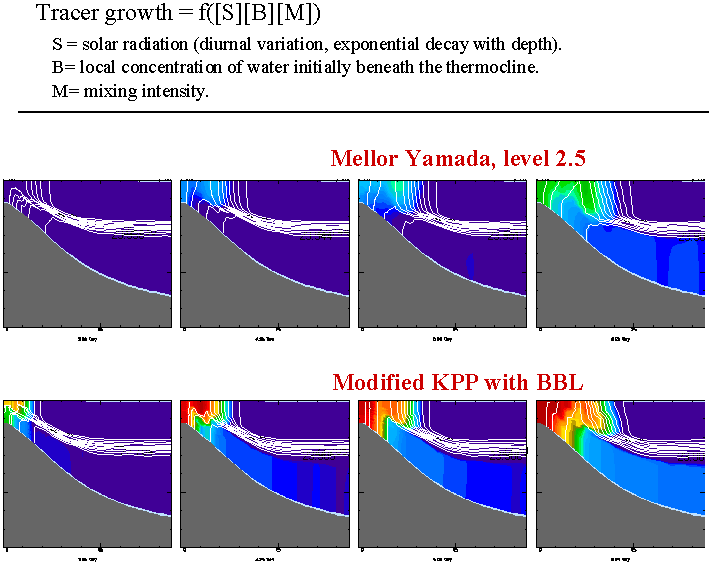
Comparison of Mixing Schemes with a Simple Active Biological
Tracer
 The above figure shows the potential importance of vertical mixing
parameterizations to the ecosystem. Each model shows data from days 2, 4, 6,
and 8 of an upwelling event. The color contours above show the time evolution
of a simple biological tracer during a modeled upwelling event. The tracer
represents a primary producer. The growth of the biological tracer is
specified as dependent on three factors; nutrients (present only in the bottom
layer waters initially), short wave radiation and intensity of vertical
mixing. The mixing dependence is meant to simulate the effect of reduced
grazing in highly turbulent conditions.
The two vertical mixing schemes are
found to produce dramatically different concentrations of this tracer by day
four. It is interesting to note that the physical fields (such as
temperature) show far less sensitivity to the vertical mixing
parameterization. Consideration of biological fields draws out the
importance of properly parameterizing vertical mixing in such a situation.
Questions???
sdurski@arctic.rutgers.edu


